The Deadliest,
Costliest, and Most Intense United States Tropical Cyclones
From 1851 to 2004
NOAA Technical Memorandum NWS TPC-4
[PDF
format]
THE DEADLIEST, COSTLIEST, AND MOST INTENSE
UNITED
STATES TROPICAL CYCLONES FROM 1851 TO 2004
(AND OTHER
FREQUENTLY REQUESTED HURRICANE FACTS)Eric S. Blake, Jerry
D. Jarrell (retired), and Edward N.
Rappaport
NOAA/NWS/Tropical Prediction Center/National
Hurricane Center
Miami, Florida
Christopher W.
Landsea
NOAA/AOML/Hurricane Research Division
Miami,
Florida
Updated
August 2005
PREFACE
This version of the Deadliest, Costliest, and Most Intense
United States Tropical Cyclones extends the work of Jarrell et
al. (2001) to begin with the year 1851. New updates include
data from the period 1851-1899 provided by the best track
reanalysis project headed by Chris Landsea, some significant
revisions to the period 1900-1914 and a revised intensity of
Hurricane Andrew [Landsea et al. (2004)]. A new feature for
this update is a list of landfalling hurricanes during this
era, updating and supplementing information provided in
Neumann et al. (1999). The paper continues the methodology of
Jarrell et al. (2001) in producing an estimate of the monetary
loss that historical hurricanes could exact on the current
property-at-risk in the same location.
During 1995, the National Meteorological Center, which
included the National Hurricane Center, was re-organized into
the National Centers for Environmental Prediction (NCEP).
Under NCEP, the National Hurricane Center became the Tropical
Prediction Center (TPC), a name which more accurately reflects
the broad scope of its responsibilities, and more formally
publicizes that the majority of its operational products were
for tropical weather events exclusive of hurricanes. The name
National Hurricane Center was retained to apply to the
hurricane operations desk at TPC. We will follow the
convention where NHC refers to the previous National
Hurricane Center, TPC refers to the current center and
TPC/NHC refers to the hurricane operations desk of
TPC.
ABSTRACT
This technical memorandum lists the deadliest and costliest
tropical cyclones in the United States during 1851-2004. The
compilation ranks damage, as expressed by monetary losses, in
three ways: 1) contemporary estimates; 2) contemporary
estimates adjusted by inflation to 2004 dollars; and 3)
contemporary estimates adjusted for inflation and the growth
of population and personal wealth [Pielke and Landsea, 1998]
to 2004. In addition, the most intense (i.e., major1
) hurricanes to make landfall in the United States during the
period are listed. Some additional statistics on United States
hurricanes of this and previous centuries, and tropical
cyclones in general, are also presented.
1. INTRODUCTION
The staff of the Tropical Prediction Center receives
numerous requests for statistical information on deaths and
damages incurred during tropical cyclones affecting the United
States. Information about their intensity is also frequently
of interest. Estimates of these measures vary in the
literature. Our hope is to present the best compilation of
currently available estimates. In some instances, data in our
lists represent revised estimates based on more complete
information received following earlier publications including
previous versions of this technical memorandum.
There are other frequently asked questions about
hurricanes, such as: What is the average number of hurricanes
per year? What year(s) had the most and least hurricanes? What
hurricane had the longest life? On what date did the earliest
and latest hurricane occur? What was the most intense Atlantic
hurricane? What was the largest number of hurricanes in
existence on the same day? When was the last time a major
hurricane or any hurricane hit a given community directly2?
Answers to these and several other questions are provided in
Section 3.
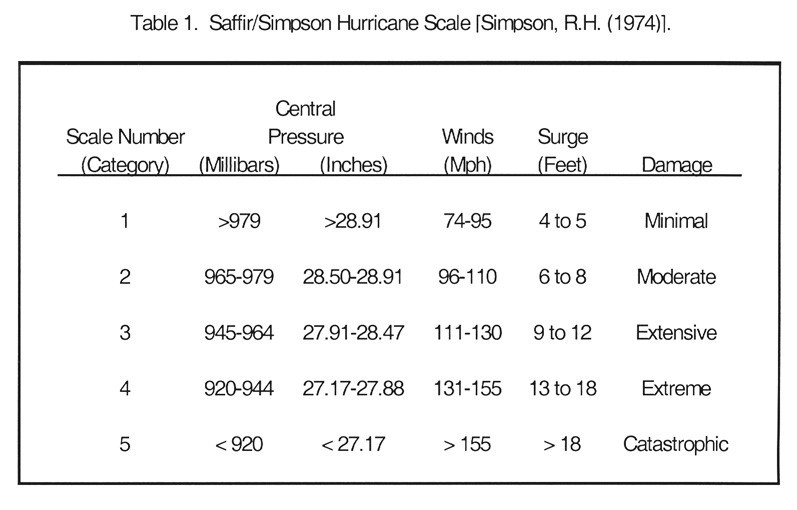
1 A major hurricane is a
category 3, 4, or 5 hurricane on the Saffir/Simpson Hurricane
Scale (see Table 1),
and is comparable to a Great Hurricane in some other
publications.
2 A
direct hit means experiencing the core of strong winds and
storm surge of a hurricane.
2. BACKGROUND AND DEFINITIONS
Many of the statistics in this publication depend directly
on the criteria used in preparing another study, Hurricane
Experience Levels of Coastal County Populations Texas to
Maine" [(Jarrell et al. (1992)]. The primary purpose of that
study was to demonstrate, county by county, the low hurricane
experience level of a large majority of the population.
Statistics show that the largest loss of life and property
occur in locations experiencing the core of a category 3 or
stronger hurricane.
The Saffir/Simpson category is defined by pressure, wind,
and storm surge. In nature, however, there is not a one-to-one
relationship between these elements. Therefore, in practice,
the TPC uses the maximum wind speed to establish the category.
Operationally, however, the central pressure is often used to
make a first estimate of the wind. Thereafter, available
surface wind reports, aircraft reconnaissance flight-level
winds (from which surface wind speed can be estimated), and
dropsonde data are used to anchor the wind estimate. In
post-storm analysis, the central pressure ranges of hurricanes
on the Saffir/Simpson Hurricane Scale will usually agree
fairly well with the wind ranges in that category. On the
other hand, the storm surge is strongly dependent on the slope
of the continental shelf (shoaling factor). This can change
the height of the surge by a factor of two for a given central
pressure and/or maximum wind.
Heavy rainfall associated with a hurricane is not one of
the criteria for categorizing.
The process of assigning a category number to a hurricane
is subjective, as is TPCs estimate of a cyclones impact . It
is made on a county by county basis. In this study, we
continue to use criteria for direct hit and indirect hit
described in the work by Jarrell et al. (1992):
Direct Hit Using "R" as the radius of maximum winds in a
hurricane (the distance in miles from the storm's center to
the circle of maximum winds around the center), all or parts
of counties falling within approximately 2R to the right and R
to the left of a storm's landfall point were considered to
have received a direct hit. (This assumes an observer at sea
looking toward the shore. If there was no landfall, the
closest point of approach was used in place of the landfall
point). On average, this direct hit zone extended about 50
miles along the coastline (R15 miles). Of course, some
hurricanes were smaller than this and some, particularly at
higher latitudes, were much larger. Cases were judged
individually, and many borderline situations had to be
resolved.
Indirect Hit In general, areas on either side of the direct
hit zone which received wind gusts of hurricane force and/or
tides of at least 4 to 5 feet above normal were considered to
have had an indirect hit. The evaluation subjectively
incorporated a hurricane's strength and size, and the
configuration of county coastlines.
The authors acknowledge that there are limitations to this
technique. For example, the effect of an indirect hit by a
large category 4 hurricane can be greater than that by a
direct hit from a small category 1 hurricane.
Neumann et al. (1999) gives the variation in tropical
cyclone frequency along the United States coastline for all
tropical storms and hurricanes, hurricanes only, and major
hurricanes (category 3 or greater). In that study, counts were
made of the number of tropical cyclones or hurricanes whose
center passed within 75 nautical miles of the coastal
location. This counting method thus includes near-misses, as
well as direct and indirect hits as defined above.
Statistics on tropical storm and hurricane activity in the
North Atlantic Ocean (which includes the Gulf of Mexico and
the Caribbean Sea) can be found in Neumann et al. (1999). A
stratification of hurricanes by category which have affected
coastal counties of the Gulf of Mexico and North Atlantic
Ocean can be found in Jarrell et al. (1992). Additional
information about the impact of hurricanes can be found in
annual hurricane season articles in Monthly Weather Review ,
Storm Data and Mariners Weather Log.
3. DISCUSSION
Part I
The remainder of this memorandum provides answers to some
of the most frequently asked questions about the
characteristics and impacts of the tropical cyclones to affect
the United States from 1851-2004.
(1) What have been the deadliest tropical cyclones in the
United States? Table 2
lists the tropical cyclones that have caused at least 25
deaths on the U.S. mainland 1851-2004. The Galveston Hurricane
of 1900 was responsible for at least 8000 deaths and remains
#1 on the list. The death total from the Lake Okeechobee
Hurricane of 1928 has been revised to include work from Pfost
(2003) to reflect that the hurricane killed at least 2500
people. Tropical Storm Allison in 2001 caused torrential
flooding in the Houston area and is the most significant
addition since 2000 to the list. However two powerful
hurricanes that struck in 1893 are now #3 and #4 on the list.
A tropical storm which affected southern California in 1939
and the deadliest Puerto Rico and Virgin Islands hurricanes
are listed as addenda.
(2) What have been the costliest tropical cyclones in the
United States? Table 3a
lists the 30 costliest tropical cyclones to strike the U.S.
mainland 1900-2004. No monetary estimates are available before
1900 and figures are not adjusted for inflation. The 2004
hurricane season had the second, third, fourth and sixth
most-costly systems to strike the United States. Table 3b
re orders the first list and adds several other hurricanes
after adjusting to 2004 dollars3.
Hawaiian, Puerto Rican and Virgin Island tropical cyclones are
listed as addenda to Tables 3a and 3b. Table 3b
also lists the thirty costliest hurricanes 1900-2004 assuming
that a hurricane having the same track, size and intensity as
noted in the historical record would strike the area with
todays population totals and property-at-risk. See Pielke and
Landsea (1998).
(3) What have been the most intense hurricanes to strike
the United States? Table 4
lists the 60 most intense major hurricanes to strike the U.S.
mainland 1851-2004. Hurricanes are ranked by estimating
central pressure at time of landfall. Hawaiian, Puerto Rican
and Virgin Island hurricanes are listed as addenda to Table
4.
A look at the lists of deadliest and costliest hurricanes
reveals several striking facts: (1) Fourteen out of the
fifteen deadliest hurricanes were the equivalent of a category
3 or higher. (2) Large death totals were primarily a result of
the 10 feet or greater rise of the ocean (storm surge)
associated with many of these major hurricanes. About
three-quarters of the deadliest hurricanes were major
hurricanes. (3) A large portion of the damage in four of the
fifteen costliest tropical cyclones (Table 3a)
resulted from inland flooding caused by torrential rain. (4)
One-third of the deadliest hurricanes were category four or
higher, but only one-seventh of the costliest hurricanes met
this criterion. (5) Only five of the deadliest hurricanes
occurred during the past twenty five years in contrast to
three-quarters of the costliest hurricanes (this drops to
one-half after adjustment for inflation and about one-third
after adjustment for inflation, population, and personal
wealth).
Addenda to tables 2 through 4 include some noteworthy
storms from the U.S. West coast and the Hawaiian Islands, as
well as in the U. S. Caribbean Islands. The rank represents
the position they would occupy if included in the main
table.
Table
5 summarizes the direct hits on the U. S. mainland since
1851. The data indicate that an average of 3 major hurricanes
every 5 years made landfall somewhere along the U.S. Gulf or
Atlantic coast. (All categories combined average about 5
hurricanes every 3 years.) Note that not all areas of the U.S.
were settled before 1900 and there could be substantial gaps
in landfall data coverage, especially in South Florida. For
more details see Landsea et al. (2004b).
One of the greatest concerns of the National Weather
Service's (NWS) hurricane preparedness officials is that the
statistics in Table 2
will mislead people into thinking that no more large loss of
life will occur in a hurricane because of our advanced
technology. Max Mayfield, spokesman for the NWS hurricane
warning service and Director of TPC, as well as former NHC
Directors, have repeatedly emphasized the great danger of a
catastrophic loss of life in a future hurricane if proper
preparedness plans for vulnerable areas are not formulated,
maintained and executed.
The study by Jarrell et al. (1992) used 1990 census data to
show that 85% of U.S. coastal residents from Texas to Maine
had never experienced a direct hit by a major hurricane. This
risk is higher today as an estimated 50 million residents have
moved to coastal sections during the past twenty five years.
The experience gained through the landfall of Charley, Ivan,
Jeanne, Andrew and Hugo has not lessened an ever-growing
concern brought by the continued increase in coastal
populations.
Table
6, which lists hurricanes by decades since 1851, shows
that during the forty year period 1961 2000 both the number
and intensity of landfalling U.S. hurricanes decreased
sharply! Based on 1901 1960 statistics, the expected number of
hurricanes and major hurricanes during the period 1961 2000
was 75 and 28, respectively. But, in fact, only 55 (or 74%) of
the expected number of hurricanes struck the U.S. with only 20
major hurricanes or 71% of that expected number. Even the very
active late 1990s showed below average landfall frequencies.
It could be noted that of the most recent four decades, only
the 70's and 80's were significantly below normal in terms of
overall tropical cyclone activity.
During the past 35 years, the United States has experienced
three Category 4 or stronger hurricanes: Charley in 2004,
Andrew of 1992 and Hugo of 1989. However, on the average, a
category 4 or stronger hurricane strikes the United States
once every 6 or 7 years. This suggests we have seen fewer
exceptionally strong hurricanes than an expected 35 year
average of about 5 or 6. Fewer hurricanes do not necessarily
mean a lesser threat of disaster, however. Records for the
most intense U.S. hurricane in 1935, and the costliest, Andrew
in 1992, occurred in years which had much below-average
hurricane activity.
A large death toll in a U.S. hurricane is still possible.
The decreased death totals in recent years could be as much a
result of lack of major hurricanes striking the most
vulnerable areas as they are of any fail proof forecasting,
warning, and observing systems.
Continued coastal growth and inflation will almost
certainly result in every future major landfalling hurricane
(and even weaker hurricanes and tropical storms) replacing one
of the current costliest hurricanes. For example, 4 out of 6
hurricane landfalls of 2004 made the top 30 list.
If warnings are heeded and preparedness plans developed,
the death toll can be reduced. In the absence of a change of
attitude, policy, or laws governing building practices (codes
and location) near the ocean, however, large property losses
are inevitable.
3 Adjusted to 2004
dollars on basis of U.S. Department of Commerce Implicit Price
Deflator for Construction. Available index numbers are rounded
to the nearest tenth. This rounding can result in slight
changes in the adjusted damage of one hurricane relative to
another.
Part II
This section answers some frequently asked questions about
tropical storm and hurricane activity.
(1) What is the average number of hurricanes per
year?
Table 7
gives the average number of tropical cyclones which reached
tropical storm, hurricane and major hurricane strength during
selected time periods. A total of eleven tropical systems
reaching storm strength with six of these becoming hurricanes
and two attaining major hurricane status are the best averages
to use based on the past 40 year time period of routine
satellite surveillance.
(2) What year(s) have had the most and least
hurricanes?
Table 8a
shows the years of maximum and minimum tropical storm and
hurricane activity for the Atlantic hurricane basin. Table 8b
lists the years of maximum United States hurricane landfalls.
The only times that the U.S. mainland has gone as long as two
years without a hurricanes are 1862-64, 1930-31, 1981-82 and
2000-01. Note there is considerable uncertainty before 1900
because significant areas of the Gulf and Southeast Atlantic
coasts were unpopulated and uninstrumented. The largest number
of hurricanes to strike in one year was seven (1886), with six
occurring in 1916, 1985, and 2004, plus five in 1893, 1909 and
1933. Three or four hurricanes have struck the U.S. in one
year a total of 37 times. Eleven U.S. hurricanes were recorded
in the two-year period 1886-87 with 15 recorded from
1886-1888.
(3) When did the earliest and latest hurricanes
occur?
The hurricane season is defined as June 1 through
November 30. An early hurricane can be defined as occurring in
the three months prior to the start of the season, and a late
hurricane can be defined as occurring in the three months
after the season. With these criteria the earliest observed
hurricane in the Atlantic was on March 7, 1908, while the
latest observed hurricane was on December 31, 1954, the second
Alice of that year which persisted as a hurricane until
January 5, 1955. The earliest hurricane to strike the United
States was Alma which struck northwest Florida on June 9,
1966. The latest hurricane to strike the U. S. was late on
November 30, 1925 near Tampa, Florida.
(4) What were the longest lived and shortest lived
hurricanes?
The third system of 1899 holds the record for
most days as a tropical storm (28) and major hurricane (11.5),
while Ginger in 1971 holds the record for the most days as a
hurricane (20). There have been many tropical cyclones which
remained at hurricane intensity for 12 hours or less.
(5) What were the strongest and weakest hurricanes?
In
terms of central pressure (and probably winds), the strongest
observed hurricane in the Atlantic basin was Gilbert in 1988
with a pressure of 888 millibars in the northwestern Caribbean
with estimated sustained winds of 185 mph. The 1935 Labor Day
hurricane in the Florida Keys, with a pressure of 892
millibars, was the most intense hurricane to strike the United
States. Numerous hurricanes have reached only the minimum wind
speed near 74 miles per hour and struck the United States.
(6) How many hurricanes have there been in each
month?
Table 9,
adapted from Neumann et al. (1999), shows the total and
average number of tropical storms, and those which became
hurricanes, by month, for the period 1851 2004. It also shows
the monthly total and average number of hurricanes to strike
the U. S. since 1851 (updated from Jarrell et.al. (2001).
(7) What was the largest number of hurricanes in the
Atlantic Ocean at the same time?<>br Four hurricanes
occurred simultaneously on two occasions. The first occasion
was August 22, 1893, and one of these eventually killed
1,000-2,000 people in Georgia South Carolina. The second
occurrence was September 25, 1998, when Georges, Ivan, Jeanne
and Karl persisted into September 27, 1998 as hurricanes.
Georges ended up taking the lives of thousands in Haiti. In
1971 from September 10 to 12, there were five tropical
cyclones at the same time; however, while most of these
ultimately achieved hurricane intensity, there were never more
than two hurricanes at any one time.
(8) How many direct hits by hurricanes of various
categories have affected each state?
Table 10,
updated from Jarrell et al. (2001), shows the number of
hurricanes affecting the United States and individual states,
i.e., direct hits. The table shows that, on the average, close
to seven hurricanes every four years (~1.75 per year) strike
the United States, while about three major hurricanes cross
the U.S. coast every five years (0.60 per year). Other
noteworthy facts, updated from Jarrell et al. (2001), are: 1.)
Forty percent of all U.S. hurricanes hit Florida; 2.)
Eighty-three percent of category 4 or higher hurricanes
strikes have hit either Florida or Texas; 3.) Pennsylvanias
only hurricane strike between 1851-2004 was 1878.
(9) When are the major hurricanes likely to strike given
areas?
Table 11
shows the incidence of major hurricanes by months for the U.S.
mainland and individual states. September has as many major
hurricane landfalls as October and August combined. Texas and
Louisiana are the prime targets for pre-August major
hurricanes. The threat of major hurricanes increases from west
to east during August with major hurricanes favoring the U.S.
East Coast by late September. Most major October hurricanes
occur in southern Florida.
(10) How long has it been since a hurricane or a major
hurricane hit a given community?
A chronological list of
all hurricanes to strike the United States 1900 through 1990
including month, states affected by category of hurricane, and
minimum sea level pressure at landfall can be found in Jarrell
et al. (1992). Appendix A extends that publication to cover
the entire database from 1851-2004. Table 12
summarizes the occurrence of the last hurricane and major
hurricane to directly hit the most populated coastal
communities from Brownsville, Texas to Eastport, Maine. In
addition, if a hurricane indirectly affected a community after
the last direct hit, it is listed in the last column of the
table. In order to obtain the same type of information listed
in Table
12 for the remaining coastal communities, the reader is
again referred to Jarrell et al. (1992) or NOAA Coastal
Services (http://hurricane.csc.noaa.gov/hurricanes/index.htm).
There are many illustrative examples of the uncertainty of
when a hurricane might strike a given locality. After nearly
70 years without a direct hit, Pensacola, Florida was hit
directly by Hurricane Erin in 1995 and major Hurricane Ivan in
2004 within 10 years. Miami, which expects a major hurricane
every nine years, on average, has been struck only once since
1950 (in 1992). Tampa has not experienced a major hurricane
for 84 years. Many locations along the Gulf and Atlantic
coasts have not experienced a major hurricane during the
period 1851-2004 (see Table
12).
(11) What is the total United States damage (before and
after adjustment for inflation) and death toll for each year
since 1900?
Table 13a
summarizes this information. Table 13b
ranks the top 30 years by deaths, by unadjusted damage and by
adjusted damage. In most years the death and damage totals are
the result of a single, major hurricane. Gentry (1966) gives
damages adjusted to 1957 59 costs as a base for the period
1915 1965. For the most part, death and damage totals for the
period 1915 1965 were taken from Gentry's paper, and for the
remaining years from Monthly Weather Review. Adjusted damages
were converted to 2004 dollars by the factors used in Table
3a.
(12) What are the deadliest and costliest hurricanes to
affect Hawaii, Puerto Rico and the U.S. Virgin Islands since
1900?
Table 14,
provided by Hans Rosendal and Raphael Mojica of the Weather
Service Forecast Offices in Honolulu and San Juan,
respectively, summarizes this information. Iniki in 1992 is
the deadliest and costliest hurricane to affect Hawaii while
Georges of 1998 is the costliest hurricane to affect Puerto
Rico. The notorious San Felipe hurricane of 1928 was the
deadliest hurricane in Puerto Rico since 1900.
(13) Are there hurricane cycles?
Figures
1 through 16 show the landfalling portion of the tracks of
major hurricanes that have struck the United States between
1851-2004. The reader might note the tendency for the major
hurricane landfalls to cluster in certain areas during certain
decades. Another interesting point is the tendency for this
clustering to occur in the latter half of individual decades
in one area and in the first half of individual decades in
another area. During the very active period of the thirties
this clustering is not apparent.
A comparison of twenty year periods beginning in 1851
indicates that the major hurricanes tended to be in Gulf Coast
states before 1891, then favored Florida and the W. Gulf until
1911, shifting to the eastern Gulf Coast states and Florida
during the next twenty years, then to Florida and the Atlantic
Coast states during the 1940s-1950s, and back to the western
Gulf Coast states in the following twenty-year period.
CONCLUSIONS
In virtually every coastal city from Texas to Maine, the
present Tropical Prediction Center Director (Max Mayfield)
former National Hurricane Center Directors have stated that
the United States is building toward its next hurricane
disaster. The population growth and low hurricane experience
levels indicated in Hebert et al. (1984), together with
updated statistics presented by Jarrell et al. (1992) form the
basis for their statements. The areas along the United States
Gulf and Atlantic coasts where most of this countrys
hurricane related fatalities have occurred are also now
experiencing the countrys most significant growth in
population. This situation, in combination with continued
building along the coast, will lead to serious problems for
many areas in hurricanes. Because it is likely that people
will always be attracted to live along the shoreline, a
solution to the problem lies in education and preparedness as
well as long-term policy and planning.
The message to coastal residents is this: Become familiar
with what hurricanes can do, and when a hurricane threatens
your area, increase your chances of survival by moving away
from the water until the hurricane has passed! Unless this
message is clearly understood by coastal residents through a
thorough and continuing preparedness effort, disastrous loss
of life is inevitable in the future.
Acknowledgments: Richard Pasch and Max Mayfield made
helpful suggestions. Paul Hebert, J.G. Taylor and R.A. Case,
co authors of previous versions of this paper, are recognized
for their enduring contributions to this work. Lenworth
Woolcock drafted the 19th century figures and Joan David
drafted the 20th and 21st century figures.
REFERENCES
Gentry, R.C., 1966:
Nature and Scope of Hurricane Damage, American Society for
Oceanography, Hurricane Symposium, Publication Number One, 344
pp.
Hebert, P.J., J.G. Taylor, and R.A. Case, 1984:
Hurricane Experience Levels of Coastal County Populations
Texas to Maine, NOAA, Technical Memorandum NWS NHC 24, 127
pp.
Hebert, P.J., J.D. Jarrell, and B.M. Mayfield,
1997: The Deadliest, Costliest and Most Intense United States
Hurricanes of This Century (and Other Frequently Requested
Hurricane Facts), NOAA, Technical Memorandum NWS TPC 1, 30
pp.
Jarrell, J.D., B.M. Mayfield, E.N. Rappaport, and
C.W. Landsea, 2001: The Deadliest, Costliest and Most Intense
United States Hurricanes from 1900 to 2000 (and Other
Frequently Requested Hurricane Facts), NOAA, Technical
Memorandum NWS TPC 3, 30 pp.
Jarrell, J.D., P.J.
Hebert, and B.M. Mayfield, 1992: Hurricane Experience Levels
of Coastal County Populations Texas to Maine, NOAA, Technical
Memorandum NWS NHC 46, 152 pp.
Landsea, C.W. et al,
2004: A Reanalysis of Hurricane Andrews Intensity, Bulletin
of the American Meteorological Society: Vol. 85, No. 11, pp.
16991712.
Landsea, C.W. et al, 2004b: The Atlantic
Hurricane Database Reanalysis Project. Documentation for
1851-1910 alterations and additions to the HURDAT database.
Hurricanes and Typhoons: Past, Present and Future, R.J.
Murnane and K.B. Liu, Eds., Columbia University Press,
177-221.
Neumann, C.J., B.R. Jarvinen, C.J. McAdie, and
J.D. Elms, 1993: Tropical Cyclones of the North Atlantic
Ocean, 1871 1992, NOAA, Historical Climatology Series 6 2, 193
pp.
Neumann, C.J., B.R. Jarvinen, C.J. McAdie, and G.R.
Hammer, 1999: Tropical Cyclones of the North Atlantic Ocean,
1871-1998, NOAA, Historical Climatology Series 6-2, 206
pp.
Pfost, R. L., 2003: Reassessing the Impact of Two
Historical Florida Hurricanes. Bulletin of the American
Meteorological Society: Vol. 84, No. 10, pp.
13671372.
Pielke, Jr., R.A., and C.W. Landsea, 1998:
Normalized U.S. Hurricane Damage. 1925-1995, Weather
Forecasting, 13, 621-631.
Simpson, R.H., 1974: The
hurricane disaster potential scale. Weatherwise, Vol. 27,
169-186.
U.S. Weather Bureau: Climatological Data and
Storm Data, various volumes, various periods, National and
State Summaries (National Weather Service 1971 1998).
U.S. Weather Bureau: Monthly Weather Review, 1872 1970
(National Weather Service 1971 1973, and American
Meteorological Society 1974 2004).
Figure
1. Landfalling United States major hurricanes 1851-1860
PDF
Figure
2. Landfalling United States major hurricanes 1861-1870
PDF
Figure
3. Landfalling United States major hurricanes 1871-1880
PDF
Figure
4. Landfalling United States major hurricanes 1881-1890
PDF
Figure
5. Landfalling United States major hurricanes 1891-1900
PDF
Figure
6. Landfalling United States major hurricanes 1901-1910
PDF
Figure
7. Landfalling United States major hurricanes 1911-1920
PDF
Figure
8. Landfalling United States major hurricanes 1921-1930
PDF
Figure
9. Landfalling United States major hurricanes 1931-1940
PDF
Figure
10. Landfalling United States major hurricanes 1941-1950
PDF
Figure
11. Landfalling United States major hurricanes 1951-1960
PDF
Figure
12. Landfalling United States major hurricanes 1961-1970
PDF
Figure
13. Landfalling United States major hurricanes 1971-1980
PDF
Figure
14. Landfalling United States major hurricanes 1981-1990
PDF
Figure
15. Landfalling United States major hurricanes 1991-2000
PDF
Figure
16. Landfalling United States major hurricanes 2001-2005
PDF
Appendix A:Chronological List of All
Hurricanes which Affected the Continental United States:
1851-2004.(Updated from Jarrell et al. 1992 and reflecting
official HURDAT reanalysis changes through 1914. Note that
from 1915 through 1979, no official wind speed estimates are
currently available.)
| Year |
Month |
States Affected and Category by States |
Highest Saffir-Simpson U.S. Category |
Central Pressure (mb) |
Max. Winds (kt) |
Name |
| 1851 |
Jun |
TX, C1 |
1 |
977 mb |
80 |
----- |
| 1851 |
Aug |
FL, NW3; GA, 1 |
3 |
960 |
100 |
Great Middle Florida |
| 1852 |
Aug |
FL, SW1 |
1 |
977 |
80 |
----- |
| 1852 |
Aug |
AL, 3; MS, 3; LA, 2; FL, NW1
|
3 |
961 |
100 |
Great Mobile |
| 1852 |
Sep |
FL, SW1 |
1 |
985 |
70 |
----- |
| 1852 |
Oct |
FL, NW2; GA, 1 |
2 |
969 |
90 |
Middle Florida |
| 1853 |
Oct * |
GA, 1 |
1 |
965 |
70 |
----- |
| 1854 |
Jun |
TX, S1 |
1 |
985 |
70 |
----- |
| 1854 |
Sep |
GA, 3; SC, 2; FL, NE1 |
3 |
950 |
100 |
Great Carolina |
| 1854 |
Sep |
TX, C2 |
2 |
969 |
90 |
Matagorda |
| 1855 |
Sep |
LA, 3; MS, 3 |
3 |
950 |
110 |
Middle Gulf Shore |
| 1856 |
Aug |
LA, 4 |
4 |
934 |
130 |
Last Island |
| 1856 |
Aug |
FL, NW2; AL, 1; GA, 1 |
2 |
969 |
90 |
Southeastern States |
| 1857 |
Sep & |
NC, 1 |
1 |
961 |
80 |
----- |
| 1858 |
Sep |
NY, 1; CT, 1; RI, 1; MA, 1
|
1 |
976 |
80 |
New England |
| 1859 |
Sep |
AL, 1; FL, NW1 |
1 |
985 |
70 |
----- |
| 1860 |
Aug |
LA, 3; MS, 3; AL, 2 |
3 |
950 |
110 |
----- |
| 1860 |
Sep |
LA, 2; MS, 2; AL, 1 |
2 |
969 |
90 |
----- |
| 1860 |
Oct |
LA, 2 |
2 |
969 |
90 |
----- |
| 1861 |
Aug * |
FL, SW1 |
1 |
970 |
70 |
Key West |
| 1861 |
Sep |
NC, 1 |
1 |
985 |
70 |
Equinoctial |
| 1861 |
Nov |
NC, 1 |
1 |
985 |
70 |
Expedition |
| 1865 |
Sep |
LA, 2; TX, N1 |
2 |
969 |
90 |
Sabine River-Lake
Calcasieu |
| 1865 |
Oct |
FL, SW2; FL, SE1 |
2 |
969 |
90 |
----- |
| 1866 |
Jul |
TX, C2 |
2 |
969 |
90 |
----- |
| 1867 |
Jun |
SC, 1 |
1 |
985 |
70 |
----- |
| 1867 |
Oct |
LA, 2; TX, S1, N1; FL, NW1
|
2 |
969 |
90 |
Galveston |
| 1869 |
Aug |
TX, C2 |
2 |
969 |
90 |
Lower Texas Coast |
| 1869 |
Sep |
LA, 1 |
1 |
985 |
70 |
----- |
| 1869 |
Sep |
RI, 3; MA, 3; NY, 1; CT, 1
|
3 |
963 |
100 |
Eastern New England |
| 1869 |
Oct & |
ME, 2; MA, 1 |
2 |
965 |
90 |
Saxbys Gale |
| 1870 |
Jul |
AL, 1 |
1 |
985 |
70 |
Mobile |
| 1870 |
Oct * |
FL, SW1, SE1 |
1 |
970 |
70 |
Twin Key West (I) |
| 1870 |
Oct |
FL, SW1 |
1 |
977 |
80 |
Twin Key West (II) |
| 1871 |
Aug |
FL, SE3, NE1, NW1 |
3 |
955 |
100 |
----- |
| 1871 |
Aug |
FL, SE2, NE1 |
2 |
965 |
90 |
----- |
| 1871 |
Sep |
FL, NW1 |
1 |
985 |
70 |
----- |
| 1873 |
Sep |
FL, NW1 |
1 |
985 |
70 |
----- |
| 1873 |
Oct |
FL, SW3, SE2, NE1 |
3 |
959 |
100 |
----- |
| 1874 |
Sep |
FL, NW1; SC, 1; NC, 1 |
1 |
985 |
70 |
----- |
| 1875 |
Sep |
TX, C3, S2 |
3 |
960 |
100 |
----- |
| 1876 |
Sep |
NC, 1; VA, 1 |
1 |
980 |
80 |
----- |
| 1876 |
Oct |
FL, SW2, SE1 |
2 |
973 |
90 |
----- |
| 1877 |
Sep |
LA, 1; FL, NW1 |
1 |
985 |
70 |
----- |
| 1877 |
Oct |
FL, NW3; GA, 1 |
3 |
960 |
100 |
----- |
| 1878 |
Sep |
FL, SW2, NE1; SC, 1; GA, 1
|
2 |
970 |
90 |
----- |
| 1878 |
Oct |
NC, 2; VA, 1; MD, 1; DE, 1;
NJ, 1; PA, 1 |
2 |
963 |
90 |
----- |
| 1879 |
Aug |
NC, 3; VA, 2 |
3 |
971 |
100 |
----- |
| 1879 |
Aug |
TX, N2; LA, 2 |
2 |
964 |
90 |
----- |
| 1879 |
Sep |
LA, 3 |
3 |
950 |
110 |
----- |
| 1880 |
Aug # |
TX, S3 |
3 |
931 |
110 |
----- |
| 1880 |
Aug |
FL, SE2, NE1, NW1 |
2 |
972 |
90 |
----- |
| 1880 |
Sep |
NC, 1 |
1 |
987 |
70 |
----- |
| 1880 |
Oct |
FL, NW1 |
1 |
985 |
70 |
----- |
| 1881 |
Aug |
GA, 2; SC, 1 |
2 |
970 |
90 |
----- |
| 1881 |
Sep |
NC, 2 |
2 |
975 |
90 |
----- |
| 1882 |
Sep |
FL, NW3; AL, 1 |
3 |
949 |
100 |
----- |
| 1882 |
Sep |
LA, 2; TX, N1 |
2 |
969 |
90 |
----- |
| 1882 |
Oct |
FL, NW1 |
1 |
985 |
70 |
----- |
| 1883 |
Sep |
NC, 2; SC, 1 |
2 |
965 |
90 |
----- |
| 1885 |
Aug |
SC, 3; NC, 2; GA, 1; FL, NE1
|
3 |
953 |
100 |
----- |
| 1886 |
Jun |
TX, N2; LA, 2 |
2 |
973 |
85 |
----- |
| 1886 |
Jun |
FL, NW2; GA, 1 |
2 |
973 |
85 |
----- |
| 1886 |
Jun |
FL, NW2 |
2 |
973 |
85 |
----- |
| 1886 |
Jul |
FL, NW1 |
1 |
985 |
70 |
----- |
| 1886 |
Aug |
TX, C4 |
4 |
925 |
135 |
Indianola |
| 1886 |
Sep # |
TX, S1, C1 |
1 |
973 |
80 |
----- |
| 1886 |
Oct |
LA, 3; TX, N2 |
3 |
955 |
105 |
----- |
| 1887 |
Jul |
FL, NW1 |
1 |
981 |
75 |
----- |
| 1887 |
Aug * |
NC, 1 |
1 |
946 |
65 |
----- |
| 1887 |
Sep |
TX, S2 |
2 |
973 |
85 |
----- |
| 1887 |
Oct |
LA, 1 |
1 |
981 |
75 |
----- |
| 1888 |
Jun |
TX, C1 |
1 |
985 |
70 |
----- |
| 1888 |
Aug |
FL, SE3, SW1; LA2 |
3 |
945 |
110 |
----- |
| 1888 |
Sep & |
MA, TS |
TS |
985 |
55 |
----- |
| 1888 |
Oct |
FL, NW2, NE1 |
2 |
970 |
95 |
----- |
| 1889 |
Sep |
LA, 1 |
1 |
985 |
70 |
----- |
| 1891 |
Jul |
TX, C1, N1 |
1 |
977 |
80 |
----- |
| 1891 |
Aug |
FL, SE1 |
1 |
985 |
70 |
----- |
| 1893 |
Aug |
NY, 1; VA, 1 |
1 |
986 |
75 |
Midnight Storm |
| 1893 |
Aug |
GA, 3; SC, 3; NC, 1; FL, NE1
|
3 |
954 |
100 |
Sea Islands |
| 1893 |
Sep |
LA, 2 |
2 |
973 |
85 |
----- |
| 1893 |
Oct |
LA, 4; MS, 2; AL, 2 |
4 |
948 |
115 |
Chenier Caminanda |
| 1893 |
Oct |
SC, 3; NC, 2; VA, 1 |
3 |
955 |
105 |
----- |
| 1894 |
Sep |
FL, SW2, NE1; SC, 1; VA, 1
|
2 |
975 |
90 |
----- |
| 1894 |
Oct |
FL, NW3; GA, 1; NY, 1; RI, 1
|
3 |
955 |
105 |
----- |
| 1895 |
Aug # |
TX, S1 |
1 |
973 |
65 |
----- |
| 1896 |
Jul |
FL, NW2 |
2 |
973 |
85 |
----- |
| 1896 |
Sep |
RI, 1; MA, 1 |
1 |
985 |
70 |
----- |
| 1896 |
Sep |
FL, NW3, NE3; GA, 2; SC, 1;
NC, 1; VA, 1 |
3 |
960 |
110 |
----- |
| 1897 |
Sep |
LA, 1; TX, N1 |
1 |
981 |
75 |
----- |
| 1898 |
Aug |
FL, NW1 |
1 |
985 |
70 |
----- |
| 1898 |
Aug |
GA, 1; SC, 1 |
1 |
980 |
75 |
----- |
| 1898 |
Oct |
GA, 4; FL, NE2 |
4 |
938 |
115 |
----- |
| 1899 |
Aug |
FL, NW2 |
2 |
979 |
85 |
----- |
| 1899 |
Aug |
NC, 3 |
3 |
945 |
105 |
----- |
| 1899 |
Oct |
NC, 2; SC, 2 |
2 |
955 |
95 |
----- |
| 1900 |
Sep |
TX, N4 |
4 |
936 |
125 |
Galveston |
| 1901 |
Jul |
NC, 1 |
1 |
983 |
70 |
----- |
| 1901 |
Aug |
LA, 1; MS, 1; AL, 1 |
1 |
973 |
80 |
----- |
| 1903 |
Sep |
FL, SE1, NW1 |
1 |
976 |
80 |
----- |
| 1903 |
Sep |
NJ, 1; DE, 1 |
1 |
990 |
70 |
----- |
| 1904 |
Sep |
SC, 1 |
1 |
985 |
70 |
----- |
| 1904 |
Oct |
FL, SE1 |
1 |
985 |
70 |
----- |
| 1906 |
Jun |
FL, SW1, SE1 |
1 |
979 |
75 |
----- |
| 1906 |
Sep |
SC, 1; NC, 1 |
1 |
977 |
80 |
----- |
| 1906 |
Sep |
MS, 2; AL, 2; FL, NW2; LA, 1
|
2 |
958 |
95 |
----- |
| 1906 |
Oct |
FL, SW3, SE3 |
3 |
953 |
105 |
----- |
| 1908 |
May & |
NC, TS |
TS |
989 |
55 |
----- |
| 1908 |
Jul |
NC, 1 |
1 |
985 |
70 |
----- |
| 1909 |
Jun |
TX, S2 |
2 |
972 |
85 |
----- |
| 1909 |
Jul |
TX, N3 |
3 |
959 |
100 |
Velasco |
| 1909 |
Aug # |
TX, S1 |
1 |
955 |
65 |
----- |
| 1909 |
Sep |
LA, 3; MS, 2 |
3 |
952 |
105 |
Grand Isle |
| 1909 |
Oct |
FL, SW3, SE3 |
3 |
957 |
100 |
----- |
| 1910 |
Sep |
TX, S2 |
2 |
965 |
95 |
----- |
| 1910 |
Oct |
FL, SW2 |
2 |
955 |
95 |
----- |
| 1911 |
Aug |
FL, NW1; AL,1 |
1 |
985 |
70 |
----- |
| 1911 |
Aug |
SC, 2; GA, 1 |
2 |
972 |
85 |
----- |
| 1912 |
Sep |
AL, 1; FL, NW1 |
1 |
988 |
65 |
----- |
| 1912 |
Oct |
TX, S2 |
2 |
973 |
85 |
----- |
| 1913 |
Jun |
TX, S1 |
1 |
988 |
65 |
----- |
| 1913 |
Sep |
NC, 1 |
1 |
976 |
75 |
----- |
| 1913 |
Oct |
SC, 1 |
1 |
989 |
65 |
----- |
| 1915 |
Aug |
TX, N4 |
4 |
945 |
---- |
Galveston |
| 1915 |
Sep |
FL, NW1 |
1 |
988 |
---- |
----- |
| 1915 |
Sep |
LA, 4 |
4 |
931 |
---- |
New Orleans |
| 1916 |
Jul |
MS, 3; AL, 3 |
3 |
948 |
---- |
----- |
| 1916 |
Jul |
MA, 1 |
1 |
----- |
---- |
----- |
| 1916 |
Jul |
SC, 1 |
1 |
980 |
---- |
----- |
| 1916 |
Aug |
TX, S3 |
3 |
948 |
---- |
----- |
| 1916 |
Oct |
AL, 2; FL, NW2 |
2 |
972 |
---- |
----- |
| 1916 |
Nov |
FL, SW1 |
1 |
----- |
---- |
----- |
| 1917 |
Sep |
FL, NW3 |
3 |
958 |
---- |
----- |
| 1918 |
Aug |
LA, 3 |
3 |
955 |
---- |
----- |
| 1919 |
Sep |
FL, SW4; TX, S4 |
4 |
927 |
---- |
----- |
| 1920 |
Sep |
LA, 2 |
2 |
975 |
---- |
----- |
| 1920 |
Sep |
NC, 1 |
1 |
----- |
---- |
----- |
| 1921 |
Jun |
TX, C2 |
2 |
979 |
---- |
----- |
| 1921 |
Oct |
FL, SW3, NE2 |
3 |
952 |
---- |
Tampa Bay |
| 1923 |
Oct |
LA, 1 |
1 |
985 |
---- |
----- |
| 1924 |
Sep |
FL, NW1 |
1 |
985 |
---- |
----- |
| 1924 |
Oct |
FL, SW1 |
1 |
980 |
---- |
----- |
| 1925 |
No-De |
FL, SW1 |
1 |
----- |
---- |
----- |
| 1926 |
Jul |
FL, NE2 |
2 |
967 |
---- |
----- |
| 1926 |
Aug |
LA, 3 |
3 |
955 |
---- |
----- |
| 1926 |
Sep |
FL, SE4, SW3, NW3; AL, 3 |
4 |
935 |
---- |
Great Miami |
| 1928 |
Aug |
FL, SE2 |
2 |
----- |
---- |
----- |
| 1928 |
Sep |
FL, SE4, NE2; GA, 1; SC, 1
|
4 |
929 |
---- |
Lake Okeechobee |
| 1929 |
Jun |
TX, C1 |
1 |
982 |
---- |
----- |
| 1929 |
Sep |
FL, SE3, NW2 |
3 |
948 |
---- |
----- |
| 1932 |
Aug |
TX, N4 |
4 |
941 |
---- |
Freeport |
| 1932 |
Sep |
AL, 1 |
1 |
979 |
---- |
----- |
| 1933 |
Aug |
TX, S2; FL, SE1 |
2 |
975 |
---- |
----- |
| 1933 |
Aug |
NC, 2; VA, 2 |
2 |
971 |
---- |
----- |
| 1933 |
Sep |
TX, S3 |
3 |
949 |
---- |
----- |
| 1933 |
Sep |
FL, SE3 |
3 |
948 |
---- |
----- |
| 1933 |
Sep |
NC, 3 |
3 |
957 |
---- |
----- |
| 1934 |
Jun |
LA, 3 |
3 |
962 |
---- |
----- |
| 1934 |
Jul |
TX, S2 |
2 |
975 |
---- |
----- |
| 1935 |
Sep |
FL, SW5, NW2 |
5 |
892 |
---- |
Labor Day |
| 1935 |
Nov |
FL, SE2 |
2 |
973 |
---- |
----- |
| 1936 |
Jun |
TX, S1 |
1 |
987 |
---- |
----- |
| 1936 |
Jul |
FL, NW3 |
3 |
964 |
---- |
----- |
| 1936 |
Sep |
NC, 2 |
2 |
----- |
---- |
----- |
| 1938 |
Aug |
LA, 1 |
1 |
985 |
---- |
----- |
| 1938 |
Sep |
NY, 3; CT, 3; RI, 3; MA, 3
|
3 |
946 |
---- |
New England |
| 1939 |
Aug |
FL, SE1, NW1 |
1 |
985 |
---- |
----- |
| 1940 |
Aug |
TX, N2; LA, 2 |
2 |
972 |
---- |
----- |
| 1940 |
Aug |
GA, 2; SC, 2 |
2 |
970 |
---- |
----- |
| 1941 |
Sep |
TX, N3 |
3 |
958 |
---- |
----- |
| 1941 |
Oct |
FL, SE2, SW2, NW2 |
2 |
975 |
---- |
----- |
| 1942 |
Aug |
TX, N1 |
1 |
992 |
---- |
----- |
| 1942 |
Aug |
TX, C3 |
3 |
950 |
---- |
----- |
| 1943 |
Jul |
TX, N2 |
2 |
969 |
---- |
----- |
| 1944 |
Aug |
NC, 1 |
1 |
990 |
---- |
----- |
| 1944 |
Sep |
NC, 3; VA, 3; NY, 3; CT, 3;
RI, 3; MA, 2 |
3 |
947 |
---- |
----- |
| 1944 |
Oct |
FL, SW3, NE2 |
3 |
962 |
---- |
----- |
| 1945 |
Jun |
FL, NW1 |
1 |
985 |
---- |
----- |
| 1945 |
Aug |
TX, C2 |
2 |
967 |
---- |
----- |
| 1945 |
Sep |
FL, SE3 |
3 |
951 |
---- |
----- |
| 1946 |
Oct |
FL, SW1 |
1 |
980 |
---- |
----- |
| 1947 |
Aug |
TX, N1 |
1 |
992 |
---- |
----- |
| 1947 |
Sep |
FL, SE4, SW2; MS, 3; LA, 3
|
4 |
940 |
---- |
----- |
| 1947 |
Oct |
GA, 2; SC, 2; FL, SE1 |
2 |
974 |
---- |
----- |
| 1948 |
Sep |
LA, 1 |
1 |
987 |
---- |
----- |
| 1948 |
Sep |
FL, SW3, SE2 |
3 |
963 |
---- |
----- |
| 1948 |
Oct |
FL, SE2 |
2 |
975 |
---- |
----- |
| 1949 |
Aug * |
NC, 1 |
1 |
980 |
---- |
----- |
| 1949 |
Aug |
FL, SE3 |
3 |
954 |
---- |
----- |
| 1949 |
Oct |
TX, N2 |
2 |
972 |
---- |
----- |
| 1950 |
Aug |
AL, 1 |
1 |
980 |
---- |
Baker |
| 1950 |
Sep |
FL, NW3 |
3 |
958 |
---- |
Easy |
| 1950 |
Oct |
FL, SE3 |
3 |
955 |
---- |
King |
| 1952 |
Aug |
SC, 1 |
1 |
985 |
---- |
Able |
| 1953 |
Aug |
NC, 1 |
1 |
987 |
---- |
Barbara |
| 1953 |
Sep |
ME, 1 |
1 |
----- |
---- |
Carol |
| 1953 |
Sep |
FL, NW1 |
1 |
985 |
---- |
Florence |
| 1954 |
Aug |
NY, 3; CT, 3; RI, 3; NC, 2
|
3 |
960 |
---- |
Carol |
| 1954 |
Sep |
MA, 3; ME, 1 |
3 |
954 |
---- |
Edna |
| 1954 |
Oct |
SC, 4; NC, 4; MD, 2 |
4 |
938 |
---- |
Hazel |
| 1955 |
Aug |
NC, 3; VA, 1 |
3 |
962 |
---- |
Connie |
| 1955 |
Aug |
NC, 1 |
1 |
987 |
---- |
Diane |
| 1955 |
Sep |
NC, 3 |
3 |
960 |
---- |
Ione |
| 1956 |
Sep |
LA, 2; FL, NW1 |
2 |
975 |
---- |
Flossy |
| 1957 |
Jun |
TX, N4; LA, 4 |
4 |
945 |
---- |
Audrey |
| 1959 |
Jul |
SC, 1 |
1 |
993 |
---- |
Cindy |
| 1959 |
Jul |
TX, N1 |
1 |
984 |
---- |
Debra |
| 1959 |
Sep |
SC, 3 |
3 |
950 |
---- |
Gracie |
| 1960 |
Sep |
FL, SW4; NC, 3; NY, 3; FL,
NE2, CT, 2; |
4 |
930 |
---- |
Donna |
| 1960 |
Sep |
MS, 1 |
1 |
981 |
---- |
Ethel |
| 1961 |
Sep |
TX, C4 |
4 |
931 |
---- |
Carla |
| 1963 |
Sep |
TX, N1 |
1 |
996 |
---- |
Cindy |
| 1964 |
Aug |
FL, SE2 |
2 |
968 |
---- |
Cleo |
| 1964 |
Sep |
FL, NE2 |
2 |
966 |
---- |
Dora |
| 1964 |
Oct |
LA, 3 |
3 |
950 |
---- |
Hilda |
| 1964 |
Oct |
FL, SW2, SE2 |
2 |
974 |
---- |
Isbell |
| 1965 |
Sep |
FL, SE3; LA, 3 |
3 |
948 |
---- |
Betsy |
| 1966 |
Jun |
FL, NW2 |
2 |
982 |
---- |
Alma |
| 1966 |
Oct |
FL, SW1 |
1 |
983 |
---- |
Inez |
| 1967 |
Sep |
TX, S3 |
3 |
950 |
---- |
Beulah |
| 1968 |
Oct |
FL, NW2, NE1 |
2 |
977 |
---- |
Gladys |
| 1969 |
Aug |
LA, 5; MS, 5 |
5 |
909 |
---- |
Camille |
| 1969 |
Sep |
ME, 1 |
1 |
980 |
---- |
Gerda |
| 1970 |
Aug |
TX, S3 |
3 |
945 |
---- |
Celia |
| 1971 |
Sep |
LA, 2 |
2 |
978 |
---- |
Edith |
| 1971 |
Sep |
TX, C1 |
1 |
979 |
---- |
Fern |
| 1971 |
Sep |
NC, 1 |
1 |
995 |
---- |
Ginger |
| 1972 |
Jun |
FL, NW1; NY, 1; CT, 1 |
1 |
980 |
---- |
Agnes |
| 1974 |
Sep |
LA, 3 |
3 |
952 |
---- |
Carmen |
| 1975 |
Sep |
FL, NW3 |
3 |
955 |
---- |
Eloise |
| 1976 |
Aug |
NY, 1 |
1 |
980 |
---- |
Belle |
| 1977 |
Sep |
LA, 1 |
1 |
995 |
---- |
Babe |
| 1979 |
Jul |
LA, 1 |
1 |
986 |
---- |
Bob |
| 1979 |
Sep |
FL, SE2, NE2; GA, 2; SC, 2
|
2 |
970 |
---- |
David |
| 1979 |
Sep |
AL, 3; MS, 3 |
3 |
946 |
---- |
Frederic |
| 1980 |
Aug |
TX, S3 |
3 |
945 |
100 |
Allen |
| 1983 |
Aug |
TX, N3 |
3 |
962 |
100 |
Alicia |
| 1984 |
Sep * |
NC, 3 |
3 |
949 |
100 |
Diana |
| 1985 |
Jul |
SC, 1 |
1 |
1002 |
65 |
Bob |
| 1985 |
Aug |
LA, 1 |
1 |
987 |
80 |
Danny |
| 1985 |
Sep |
AL, 3; MS, 3; FL, NW3 |
3 |
959 |
100 |
Elena |
| 1985 |
Sep |
NC, 3; NY,3; CT,2; NH,2;
ME,1 |
3 |
942 |
90 |
Gloria |
| 1985 |
Oct |
LA, 1 |
1 |
971 |
75 |
Juan |
| 1985 |
Nov |
FL, NW2 |
2 |
967 |
85 |
Kate |
| 1986 |
Jun |
TX, N1 |
1 |
990 |
75 |
Bonnie |
| 1986 |
Aug |
NC, 1 |
1 |
990 |
65 |
Charley |
| 1987 |
Oct |
FL, SW1 |
1 |
993 |
65 |
Floyd |
| 1988 |
Sep |
LA, 1 |
1 |
984 |
70 |
Florence |
| 1989 |
Aug |
TX, N1 |
1 |
986 |
70 |
Chantal |
| 1989 |
Sep |
SC, 4 |
4 |
934 |
120 |
Hugo |
| 1989 |
Oct |
TX, N1 |
1 |
983 |
75 |
Jerry |
| 1991 |
Aug |
RI, 2; MA, 2; NY, 2; CT, 2
|
2 |
962 |
90 |
Bob |
| 1992 |
Aug |
FL, SE5, SW4; LA, 3 |
5 |
922 |
145 |
Andrew |
| 1993 |
Aug * |
NC, 3 |
3 |
960 |
100 |
Emily |
| 1995 |
Aug |
FL, NW2, SE1 |
2 |
973 |
85 |
Erin |
| 1995 |
Oct |
FL, NW3 |
3 |
942 |
100 |
Opal |
| 1996 |
Jul |
NC, 2 |
2 |
974 |
90 |
Bertha |
| 1996 |
Sep |
NC, 3 |
3 |
954 |
100 |
Fran |
| 1997 |
Jul |
LA, 1; AL, 1 |
1 |
984 |
70 |
Danny |
| 1998 |
Aug |
NC, 2 |
2 |
964 |
95 |
Bonnie |
| 1998 |
Sep |
FL, NW1 |
1 |
987 |
70 |
Earl |
| 1998 |
Sep |
FL, SW2; MS, 2 |
2 |
964 |
90 |
Georges |
| 1999 |
Aug |
TX, S3 |
3 |
951 |
100 |
Bret |
| 1999 |
Sep |
NC, 2 |
2 |
956 |
90 |
Floyd |
| 1999 |
Oct |
FL, SW1 |
1 |
987 |
70 |
Irene |
| 2002 |
Oct |
LA, 1 |
1 |
963 |
80 |
Lili |
| 2003 |
Jul |
TX, C1 |
1 |
979 |
80 |
Claudette |
| 2003 |
Sep |
NC, 2; VA, 1 |
2 |
957 |
90 |
Isabel |
| 2004 |
Aug * |
NC, 1 |
1 |
972 |
70 |
Alex |
| 2004 |
Aug |
FL, SW4, SE1, NE1; SC,1;
NC,1 |
4 |
941 |
130 |
Charley |
| 2004 |
Aug |
SC, 1 |
1 |
985 |
65 |
Gaston |
| 2004 |
Sep |
FL, SE2, SW1 |
2 |
960 |
90 |
Frances |
| 2004 |
Sep |
AL, 3; FL, NW3 |
3 |
946 |
105 |
Ivan |
| 2004 |
Sep |
FL, SE3, SW1, NW1 |
3 |
950 |
105 |
Jeanne
|
Notes:
States Affected and Category by States Affected: The impact
of the hurricane on individual U.S. states based upon the
Saffir-Simpson Scale (through the estimate of the maximum
sustained surface winds at each state). TX S-South Texas, TX
C-Central Texas, TX N-North Texas, LA-Louisiana,
MS-Mississippi, AL-Alabama, FL NW-Northwest Florida, FL
SW-Southwest Florida, FL SE-Southeast Florida, FL NE-Northeast
Florida, GA-Georgia, SC-South Carolina, NC-North Carolina,
VA-Virginia, MD-Maryland, DE-Delaware, NJ-New Jersey, NY-New
York, PA-Pennsylvania, CT-Connecticut, RI-Rhode Island,
MA-Massachusetts, NH-New Hampshire, ME-Maine. In Texas, south
refers to the area from the Mexican border to Corpus Christi;
central spans from north of Corpus Christi to Matagorda Bay
and north refers to the region from north of Matagorda Bay to
the Louisiana border. In Florida, the north-south dividing
line is from Cape Canaveral [28.45N] to Tarpon Springs
[28.17N]. The dividing line between west-east Florida goes
from 82.69W at the north Florida border with Georgia, to Lake
Okeechobee and due south along longitude 80.85W.)
Highest U.S. Saffir-Simpson Category: The highest
Saffir-Simpson Hurricane Scale impact in the United States
based upon estimated maximum sustained surface winds produced
at the coast.
Central Pressure: The observed (or analyzed from peripheral
pressure measurements) central pressure of the hurricane at
landfall.
Maximum Winds: Estimated maximum sustained (1-min) surface
(10 m) winds to occur along the U. S. coast. Winds are
estimated to the nearest 10 kt for the period of 1851 to 1885
and to the nearest 5 kt for the period of 1886 to date. (1 kt
= 1.15 mph.)
* - Indicates that the hurricane center did not make a U.S.
landfall (or substantially weakened before making landfall),
but did produce the indicated hurricane force winds over land.
In this case, central pressure is given for the hurricane's
point of closest approach.
& - Indicates that the hurricane center did make a
direct landfall, but that the strongest winds likely remained
offshore. Thus the winds indicated here are lower than in
HURDAT.
# - Indicates that the hurricane made landfall over Mexico,
but also caused sustained hurricane force surface winds in
Texas. The strongest winds at landfall impacted Mexico, while
the weaker maximum sustained winds indicated here were
conditions estimated to occur in Texas. Indicated central
pressure given is that at Mexican landfall.
Additional Note: Because of the sparseness of towns and
cities before 1900 in some coastal locations along the United
States, the above list is not complete for all states. Before
the Gulf of Mexico and Atlantic coasts became settled,
hurricanes may have been underestimated in their intensity or
missed completely for small-sized systems (i.e., 2004s
Hurricane Charley). The following list provides estimated
dates when accurate tropical cyclone records began for
specified regions of the United States based upon U.S Census
reports and other historical analyses. Years in parenthesis
indicate possible starting dates for reliable records before
the 1850s that may be available with additional research:
Texas-south 1880, Texas-central 1851, Texas-north
1860, Louisiana 1880, Mississippi 1851, Alabama < 1851
(1830), Florida-northwest 1880, Florida-southwest 1900,
Florida-southeast 1900, Florida-northeast 1880, Georgia
< 1851 (1800), South Carolina < 1851 (1760), North
Carolina < 1851 (1760), Virginia < 1851 (1700), Maryland
< 1851 (1760), Delaware < 1851 (1700), New Jersey <
1851 (1760), New York < 1851 (1700), Connecticut < 1851
(1660), Rhode Island < 1851 (1760), Massachusetts < 1851
(1660), New Hampshire < 1851 (1660),and Maine < 1851
(1790).
|


